Absenteeism: Using the City of Toronto's Open Data to Analyze Councillor Voting Behaviour
We live in a data-obsessed world, and the number of publicly available datasets continuously grows. So many of these datasets go unanalyzed, so I decided to have some fun exploring lesser-known datasets and seeing what sorts of conclusions I could draw. In this project I used attendance data from the city councils of Toronto to study councillor absenteeism. You can see the jupyter notebook upon which this is based here.
Toronto Council Attendance
Many municipalities have open source data available on a very wide number of topics. For example, in Toronto you can find data on everything from all public city-provided wifi, to red-light camera locations, to restaurant food inspection results. Here are the data for Toronto, and specifically the data used in this analysis is here.
I wanted to begin with a simple dataset to estabilish some familiarity with the open data and to make sure I can get everything running smoothly on my laptop. The Toronto city council meeting attendance data seemed to fit the bill, since I assumed it would consist of binary (yes/no) data on a long list of meetings. How often is the typical councillors absent? How different are the outliers? As a Torontonian myself, this seems like an interesting question. Since the data goes back to 2006, I could even check news-worthy claims like if former mayor Rob Ford’s (in)famous absenteeism was actually a justified criticism!
One important caveat of these data is that there are sometimes legitimate reasons why a councillor might not be present. For example, if a councillor has a conflict-of-interest in a meeting, being ‘absent’ would be a good thing! Additionally, not all meetings are created equal, and some might be considered trivial or irrelevant to certain councillors. The answers to these kinds of judgements won’t come from the data, but analyzing the data gives us a good starting point.
Our data looks something like this:
| _id | Term | First Name | Last Name | Committee | MTG # | Session Date | Session Type | Session Start-End Time | Present | |
|---|---|---|---|---|---|---|---|---|---|---|
| 0 | 1 | 2022-2026 | Paula | Fletcher | CreateTO | 1 | 2022-11-18 | Morning | 09:31AM - 09:50AM | N |
| 1 | 2 | 2022-2026 | Paul | Ainslie | City Council | 1 | 2022-11-23 | Afternoon | 14:03PM - 15:25PM | Y |
| 2 | 3 | 2022-2026 | Brad | Bradford | City Council | 1 | 2022-11-23 | Afternoon | 14:03PM - 15:25PM | Y |
| 3 | 4 | 2022-2026 | Alejandra | Bravo | City Council | 1 | 2022-11-23 | Afternoon | 14:03PM - 15:25PM | Y |
| 4 | 5 | 2022-2026 | Jon | Burnside | City Council | 1 | 2022-11-23 | Afternoon | 14:03PM - 15:25PM | Y |
We can imagine it as a giant table with one row per councillor/mayor per meeting. We get a Y/N for whether they’ve attended the meeting, and when the meeting occurred. This data includes not only City Council meetings, but also various committees which typically only include a subset of the councillors. This is 86k entries over 17 years, though if we restrict it to only City Council meetings, we have 53k entries to work with.
After removing the low sample size councillors, we can take a look at how often councillors showed up to council, sorted from most truant to least:
| Name | TimesElegibleToAttend | TimesPresent | AttendancePercent |
|---|---|---|---|
| Giorgio Mammoliti | 1027 | 613 | 59.6884 |
| Ron Moeser | 831 | 515 | 61.9735 |
| Michelle Holland | 286 | 191 | 66.7832 |
| Rob Ford | 751 | 527 | 70.1731 |
| Jaye Robinson | 1186 | 900 | 75.8853 |
| Michelle Berardinetti | 587 | 462 | 78.7053 |
| Mark Grimes | 1283 | 1015 | 79.1115 |
| … | … | … | … |
| John Tory | 673 | 641 | 95.2452 |
| Nick Mantas | 182 | 176 | 96.7033 |
| Jennifer McKelvie | 313 | 303 | 96.8051 |
| Sarah Doucette | 873 | 846 | 96.9072 |
| Frances Nunziata | 1340 | 1304 | 97.3134 |
| Doug Holyday | 479 | 471 | 98.3299 |
| Gord Perks | 1340 | 1322 | 98.6567 |
| Stephen Holyday | 707 | 704 | 99.5757 |
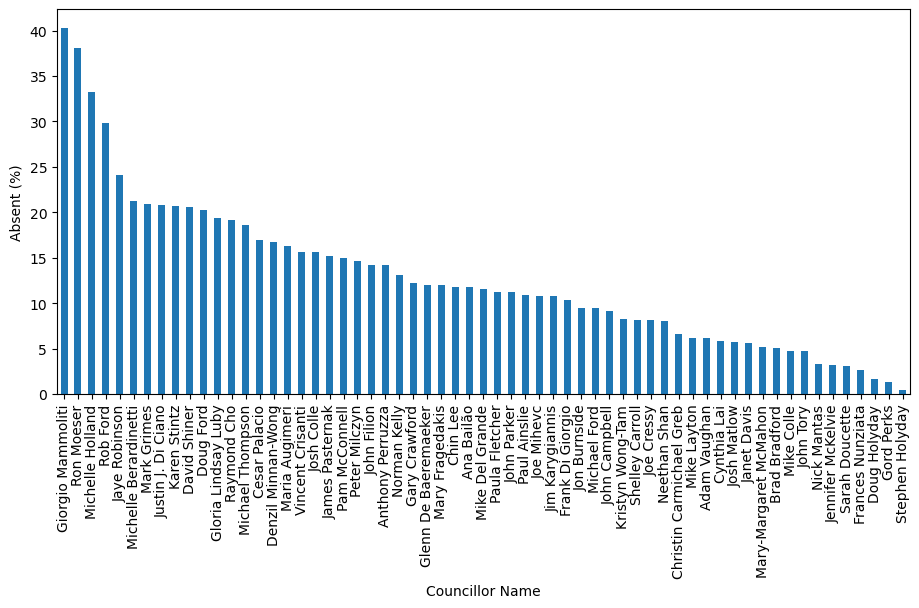
The average city councillor has an attendance of ~87%. Some councillors have attended almost every meeting they were able to (looking at you, Stephen Holyday!), whereas some are missing a quarter or more! Our anecdote about Rob Ford seems to hold up as there are only 2 councillors who attended fewer meetings, though both Ford and Ron Moeser suffered from cancer and eventually succumbed while in office. Giorgio Mammoliti, on the other hand, had fewer health issues, and was notorious for his absences even before health became a factor. I didn’t know anything about him until this analysis, but he’s quite the character and I highly recommend anyone interested to look him up!
Our dataset also includes the time of the meeting, so let’s see if there are any trends there:
| Session Type | Attendance (%) |
|---|---|
| Evening | 81.4215 |
| Afternoon | 86.3944 |
| Morning | 89.4374 |
Looks like our councillors are early-birds, not night owls!
There is more we could do with these data, but now that I have my feet wet, it’s time to tackle a more complex analysis in the next blog post…